The Mann-Kendall statistical test for trend is used to assess whether a set of data values is increasing over time or decreasing over time, and whether the trend in either direction is statistically significant. The Mann-Kendall test does NOT assess the magnitude of change.
Conduent HCI has selected the Mann-Kendall test for trend over other statistical trend tests because it can be used for indicators with varying units and time periods and does not require confidence intervals (which are not available for all indicators). In addition, the test can still be performed even when there are missing values in the set.
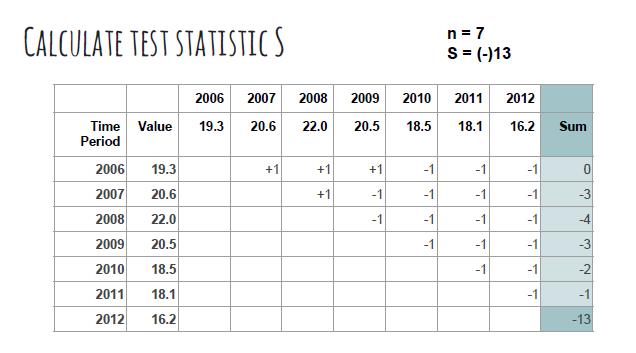
The Conduent HCI platform calculates the Mann-Kendall trend using between four and ten indicator values, depending on data availability and comparability. To calculate the test statistic, S, we compare each value to all subsequent time period values for the indicator. For each comparison pair, we assign a "+1" score if the latter value is greater than the former value. If the latter value is lower than the former value, then the comparison is assigned a "-1" score. All scores are then summed to calculate the test statistic, S. A positive S value means that the trend is increasing, and a negative S value means that the trend is decreasing.
Below is an example using the indicator "Child Abuse Rate":

Statistical significance for the test result is determined using the table below, where n is the number of data values used in the test. Conduent HCI determines significance at 90% confidence (alpha = 0.10).
(Gilbert RO (1987). Statistical Methods for Environmental Pollution Monitoring. New York: Van Nostrand Reinhold.)
